Graph Plot - Data Analysis and Plotting

Graph Plot - Data Analysis and Plotting for PC and Mac

Published by Ning Qu on 2024-04-14

  • Compatibility: Available on Windows 11, Windows 10, Windows 7 & MacOS 10, 11, 10.8
  • Category: Graphics & Design
  • Licence: $9.99
  • Software version: 1.0
  • File size: 4.50 MB


Download ⇩


Graph Plot Overview

What is Graph Plot? Graph Plot is a software application designed for scientists and engineers to perform data analysis and publication-quality graphing. It offers an easy-to-use interface for beginners and advanced customization options for experienced users. The application includes features such as graphing, data analysis, maths and simulation, 2-D visualization, optimization, statistics, control system design and analysis, and export options. With over 70 built-in graph types, users can create and customize various types of plots and charts. The application also includes tools for peak analysis, curve fitting, statistics, signal processing, and solving constrained and unconstrained optimization problems. Users can export graphs into multiple formats.


Screenshots

→   →   →   →  


Graph Plot - Data Analysis and Plotting Features and Description

1. Graph Plot is a software application for data analysis and publication-quality graphing, tailored to the needs of scientists and engineers.

2. Graph Plot is a software application for data analysis and publication-quality graphing, tailored to the needs of scientists and engineers.

3. The application offers an easy-to-use interface for beginners, and the ability for advanced users to customize analysis and graphing tasks using themes, templates, custom reports, batch processing.

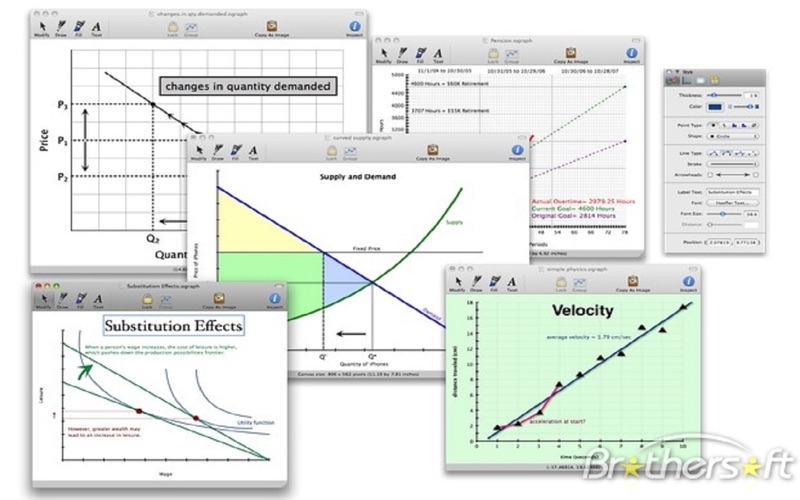
4. With over 70 built-in graph types, makes it easy to create and customize publication quality graphs to suit your needs.

5. Graphics functions to visualize, annotate and export data and many ways to create and customize various types of plots and charts.

6. For usual engineering and science applications including mathematical operations and data analysis.

7. Algorithms to solve constrained and unconstrained continuous and discrete optimization problems.


Pros:

  • - Allows user to copy and paste data
  • - Allows user to add a trend line, goal line, and multiple phase lines
  • - Allows user to add notes for specific data points
  • - Allows user to draw a key
  • - Allows user to export graph in a variety of formats
  • - Allows user to copy and paste graphic into a larger document

Download Graph Plot - Data Analysis and Plotting Latest Version


Download and Install Graph Plot - Data Analysis and Plotting - PC

Download for PC - server 1 -->

PC Alternatives:
Get Alternatives for Windows

MAC Download:
Download for MacOS - server 1 --> $9.99

Installation Requirements

PC Compactibility/Requirements for Installation

Compactible OS list:
  1. Windows 11
  2. Windows 10
  3. Windows 8.1
  4. Windows 7
  5. Windows Vista

Requirements for MacOS Installation

Intel, 64-bit processor, OS X 10.7 or later.

Compactible OS list:
  1. macOS Ventura: 13.3
  2. macOS Monterey: 12.6.4
  3. macOS Big Sur: 11.7.5
  4. macOS Catalina: 10.15
  5. macOS Mojave: 10.14
  6. macOS High Sierra: 10.13

FAQs

Graph Plot - Data Analysis and Plotting - Is it safe to download?

Yes. The app is 100 percent (100%) safe to download and Install. Our download links are from safe sources and are frequently virus scanned to protect you

Software Reviews and Criticism


  • By Jen5250

    Very Intuitive and full featured

    I puchased this program last night in desparation for a graphing assignment (Special Ed) that was not going well with more traditional software. I was working with a time limit and honestly didn’t expect much. Graph Plot allowed me to copy and paste my data, add a trend line (best fit), goal line, multiple phase lines, and notes for specific data points quickly and elegantly. Anything that the program didn’t have onboard I was able to draw, including a key (necessary for the assignment, but not with the labeling tools within the program). I was able to export the graph in a variety of formats (PDF, JPEG, PNG, EPS) or copy it as a graphic and paste it into a larger document easily and quickly. This is by far one of the best programs I’ve downloaded from the App Store. It was well worth the $9.99!


  • By Fauxscot

    Misleading crap in description...

    I bought this looking for a tool to plot some time series data. Info on the app store led me to believe that this program contained data modification and analysis tools but it’s basically a drawing program with sophomoric basic capabilities and has no data modification functions at all. Nothing. Nada. Zip. Zero. A waste of time and money for me and I’m uninstalling it 30 minutes after I overpaid for it. Nice first program, kid.


  • By OsoUrsa

    Broken and usupported

    Color picker no longer works and basically everything is broken under High Sierra. This should be removed from the App Store.


Leave a review or comment


keyboard_arrow_up